


Most agency owners find out how the business is really doing once a year, when the accountant sends the numbers. By then a slow-paying client, an underpriced retainer or a quiet pipeline has already done its damage.
You don’t need a finance team to avoid that. You need seven numbers, one simple sheet and about fifteen minutes every Monday morning. This guide explains each number, how to work it out, and what the research says a healthy figure looks like.
In this article
Why weekly, not yearly
Agencies run on thin buffers. Small businesses have less cash in reserve than most owners assume, many of them are waiting on unpaid invoices, and billable time across the services industry just hit a record low:
With that little margin for error, a yearly check is far too slow. A weekly look shows you a problem while one phone call can still fix it.
The seven numbers at a glance
| Number | What it tells you | Healthy sign |
|---|---|---|
| 1. Cash runway | How long you could run on the cash you have | At least a month, ideally two or more |
| 2. Overdue invoices | How much of your money clients are holding | Nothing more than 30 days late |
| 3. Billable utilization | How much paid time you are actually selling | About 70% or more for delivery staff |
| 4. Delivery margin | Whether each client actually makes you money | 50% or more across the agency |
| 5. Recurring revenue | How much income you can count on next month | 25% or more of revenue |
| 6. Client concentration | How exposed you are to losing one client | No single client near a quarter of revenue |
| 7. Pipeline coverage | Whether next quarter is already taken care of | Booked plus likely work covers your target |
Some of these move every week, like cash and overdue invoices. Others, like recurring revenue and concentration, move slowly. Glance at all seven weekly, and act on the slow ones monthly.
1. Cash runway: how many days could you last?

Your bank balance on its own means little. What matters is how many days it would last. The JPMorgan Chase Institute calls this cash buffer days, and after studying 597,000 small businesses it found the typical one holds just 27 days. A quarter hold fewer than 13. Professional services firms do a little better, with a median of 33 days.
How to work it out: add up last month’s spending (salaries, contractors, software, rent, tax set-asides) and divide by 30. Then divide the cash in your business account by that daily figure. $45,000 in the bank and $1,500 a day of spending gives you 30 days of runway.
If your runway is shrinking week after week, you’ll see it months before it becomes a crisis. The FDIC and SBA’s free Money Smart guide to managing cash flow is a good, plain-language place to learn the basics of a cash forecast.
2. Overdue invoices: money you’ve earned but don’t have
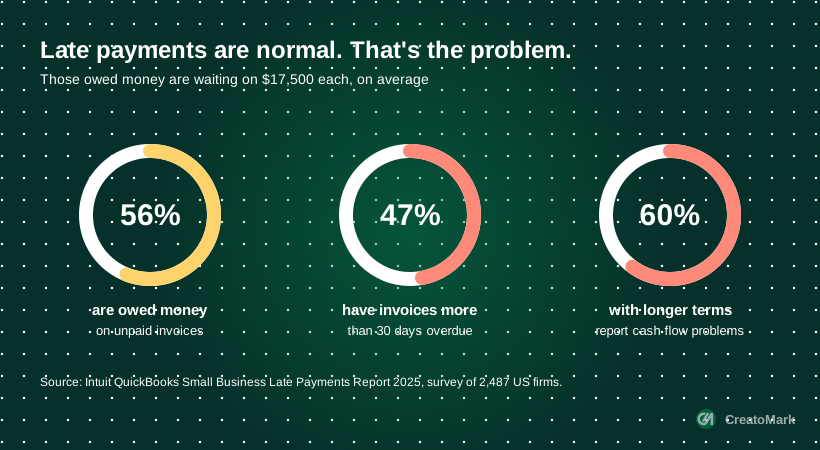
In the Intuit QuickBooks 2025 Late Payments Report, a survey of 2,487 US small businesses, 56% were owed money on unpaid invoices, and those businesses were waiting on about $17,500 each. Almost half had invoices more than 30 days overdue.
Payment terms matter too. In the same survey, 60% of businesses with longer payment terms reported cash flow problems, against 40% of those paid immediately. It’s a survey, so it shows a link rather than proof, but the direction is clear.
Each week, check two figures: the total owed to you, and how much of it is more than 30 days late. The second one is the number to act on.
Send the invoice when the work is delivered, not at the end of the month. Every day you wait is added to the payment delay.
Ask for 30% to 50% up front on projects. It funds the work and filters out clients who were never going to pay on time.
Monthly work is invoiced at the start of the month, so you are never financing a client’s retainer.
Polite reminders at 3, 7 and 14 days overdue, sent by your invoicing tool, so chasing never depends on your mood.
3. Billable utilization: are you selling your time?
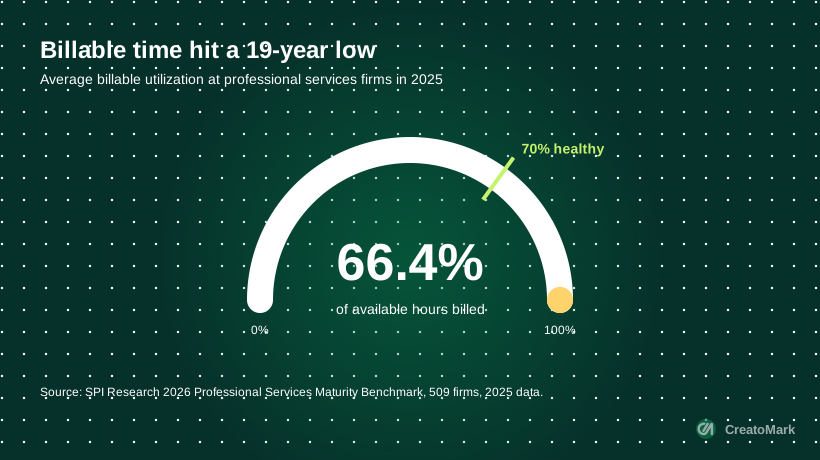
Utilization is the share of available hours that end up on a client’s bill. The SPI Research 2026 benchmark, covering 509 professional services firms, found average billable utilization fell to 66.4% in 2025, its lowest in 19 years and below the 70% level SPI considers healthy. Profit followed it down: average EBITDA was 9.9%, against a five-year average of 13.8%.
How to work it out: billable hours last week divided by available hours. A designer with 40 hours available who logged 28 hours of client work is at 70%. Track it for the people who deliver the work, not for yourself or your sales time.
Agency consultancy Parakeeto suggests targets of 75% to 90% weekly for designers, developers and writers, and 50% to 60% across the whole team over a year. Don’t chase 100%. A team that is fully booked every week has no room for training, internal work or the urgent job your best client sends on Friday.
4. Delivery margin: does each client actually pay?
Revenue tells you how busy you are. Margin tells you whether the work was worth it. Delivery margin is what’s left of a client’s fees after you pay the people and partners who delivered the work.
Start with your real income. Parakeeto calls it AGI (agency gross income): revenue minus pass-through costs like ad spend or software you resell at cost. Then subtract delivery costs. Its benchmarks aim for 60% to 70% margin per project and 50% or more across the whole agency, since agency-wide margins usually come in 10 to 20 points lower.
A quick example (illustrative)
| Client | Monthly fee | Delivery cost | Delivery margin |
|---|---|---|---|
| Client A | $4,000 | $1,400 | 65%, healthy |
| Client B | $2,500 | $1,500 | 40%, check scope and price |
| Client C | $1,800 | $1,500 | 17%, losing money after overhead |
You won’t recalculate this every week, but you should glance at hours logged per client. When a retainer starts eating more hours than it pays for, that’s scope creep, and the fix is a conversation about scope or a price increase, not more weekends.
5. Recurring revenue: how much of next month is already paid for?
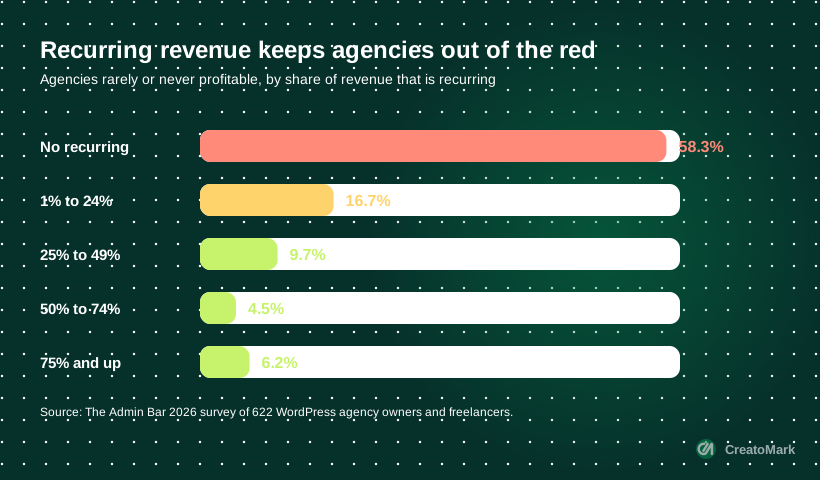
The Admin Bar’s 2026 survey of 622 WordPress agency owners and freelancers found a striking pattern. Agencies with no recurring revenue were rarely or never profitable 58.3% of the time. Once recurring revenue reached 25% of the total, that dropped below 10% and stayed there.
The survey’s authors are careful to note that healthy businesses may simply find it easier to sell retainers. Either way, recurring income makes the other six numbers calmer. Care plans, SEO and content retainers and monthly support are the usual starting points, as we cover in turning website projects into monthly revenue and productized services.
Weekly, check one thing: did any retainer start, end or shrink? Watch for retainers that quietly get smaller rather than cancelled, the pattern we call soft churn.
6. Client concentration: what if your biggest client left?
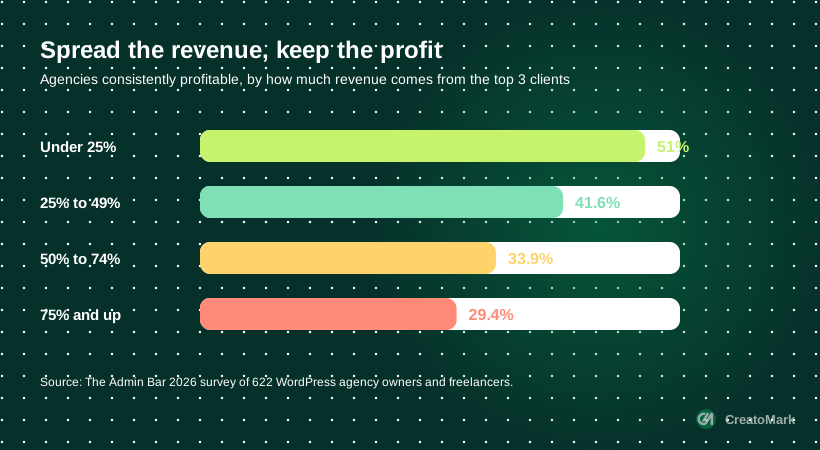
In the same Admin Bar survey, 51% of agencies whose top three clients made up less than a quarter of revenue were consistently profitable. When the top three made up 75% or more, that fell to 29.4%.
To work it out, divide each client’s revenue over the last 12 months by your total revenue. Parakeeto describes high concentration as one client bringing in about 25% or more, and suggests setting your own limit. Many owners pick 20%. If one client is above your line, that isn’t a reason to lose them. It’s a reason to grow the others, and to keep that client especially happy while you do.
Your biggest client is your biggest asset and your biggest risk at the same time. The number tells you which one it is this month.
7. Pipeline coverage: is next quarter taken care of?
The first six numbers describe today. The seventh describes the next 90 days. Add up the work that is signed and the work that is likely, and compare it with what you need to earn.
01
Set a 90-day target
What you need to earn in the next three months to cover costs, pay yourself and keep your margin.
02
Add booked work
Signed projects and active retainers that will be invoiced in that period.
03
Add likely work, weighted
For each open proposal, multiply its value by an honest chance of winning, based on your own past win rate.
04
Find the gap
Target minus booked minus weighted pipeline. If the gap grows two weeks in a row, it’s time to sell, not just deliver.
Small agencies tend to sell in bursts: busy months leave no time for sales, which creates the quiet months after them. Checking this number weekly is how you break that cycle.
Your 15-minute Monday routine

You don’t need new software. A spreadsheet with one row per week and one column per number works. Pull figures from your bank, your invoicing tool and your time tracker, then give each number a colour.
Red flags to act on this week
One action for each red
The rule is simple: one red number, one action, one owner, this week. Owners who check their numbers this way also find it easier to prove their value to clients every month, because the habit of reporting starts at home.
Where a white-label partner changes the numbers
Three of these numbers, utilization, delivery margin and runway, depend heavily on how you staff delivery. A full-time hire is a fixed cost: if work dips, utilization drops and runway shrinks. We compare the full costs in white-label vs hiring.
A white-label partner turns part of that cost into a variable one: you pay for delivery when you have work to deliver, at a price you know before you quote the client. That makes your margin predictable per project and helps you scale without burning out. At CreatoMark, our own team handles WordPress development, care plans and more, under your brand.
Want healthier numbers next quarter? Book a growth call and we’ll look at which work could move to a fixed-price partner, or compare plans on our pricing table.
Your weekly agency scorecard
The bottom line
Agencies rarely fail because of one bad month. They struggle because small problems run for months before anyone looks: an overdue invoice, an underpriced client, a pipeline that went quiet.
Seven numbers, fifteen minutes, every Monday. It’s the cheapest insurance your agency will ever buy, and it lets you make growth decisions from facts instead of from your inbox.